District 02, Singapore
ONE BERNAM
ShareDistrict
D02 · Anson, Tanjong Pagar
Tenure
99-year leasehold
Developer sales recorded
May 2021 – Feb 2025
As at Aug 2025, the developer had sold all 351 units, with recorded sales at a median S$2,545 psf.
ONE BERNAM prices
How much is sold
Sold to date
351 of 351
Sold out, as at Aug 2025
Sold in Aug 2025
0
units
| Month | Sold in month | Sold to date |
|---|---|---|
| Aug 2025 | 0 | 351 |
| Jul 2025 | 0 | 351 |
| Jun 2025 | 0 | 351 |
| May 2025 | 0 | 351 |
| Apr 2025 | 0 | 351 |
| Mar 2025 | 0 | 351 |
| Feb 2025 | 4 | 351 |
| Jan 2025 | 99 | 348 |
| Dec 2024 | 3 | 259 |
| Nov 2024 | 15 | 256 |
| Oct 2024 | 7 | 241 |
| Sep 2024 | 2 | 234 |
Units sold to date: URA developer sales survey, reported by developers (options to purchase issued), as at Aug 2025.
What buyers have actually paid
Median PSF
S$2,545
private condo developer sales, all recorded
Developer (New Sale) caveats lodged with URA for this project, which URA records as private condo. Medians are per-transaction, PSF on strata floor area as URA records it, which excludes voids for projects under URA's harmonised floor area rules (DC22-09) and may include them for older ones, and EC and private condo prices are never pooled. Source: URA, last updated Nov 2026.
Prices by unit size
| Size | Sales | Middle half of prices | Median PSF |
|---|---|---|---|
| Under 500 sqft | 41 | S$1,295,000 – S$1,389,000 | S$2,955 |
| 500 – 699 sqft | 43 | S$1,766,500 – S$1,935,315 | S$2,614 |
| 700 – 899 sqft | 166 | S$1,914,250 – S$2,147,000 | S$2,525 |
| 1,200 – 1,599 sqft | 28 | S$3,429,500 – S$3,600,000 | S$2,469 |
Developer (New Sale) caveats lodged with URA. The middle half is the 25th to 75th percentile price; a size band with fewer than 8 sales is not shown. PSF is on strata floor area as URA records it, which excludes voids for projects under URA's harmonised floor area rules (DC22-09) and may include them for older ones. Last updated Nov 2026.
Location & connectivity
ONE BERNAM Location
The ring is 1 km from the project — about a twelve-minute walk. Map data from OneMap, © Singapore Land Authority.
MRT / LRT
Primary schools
Parks
Hawker centres
MRT stations, schools, parks and hawker centres within 1 km. Distances are straight-line. Contains information from OneMap, © Singapore Land Authority.
Nearby launches
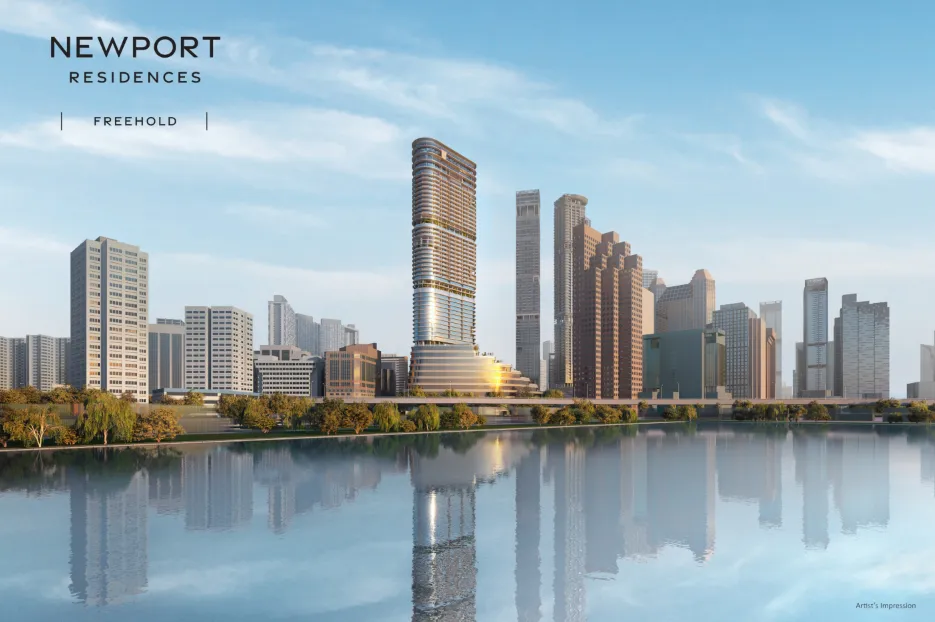 Selling
Newport Residences 铂海峰
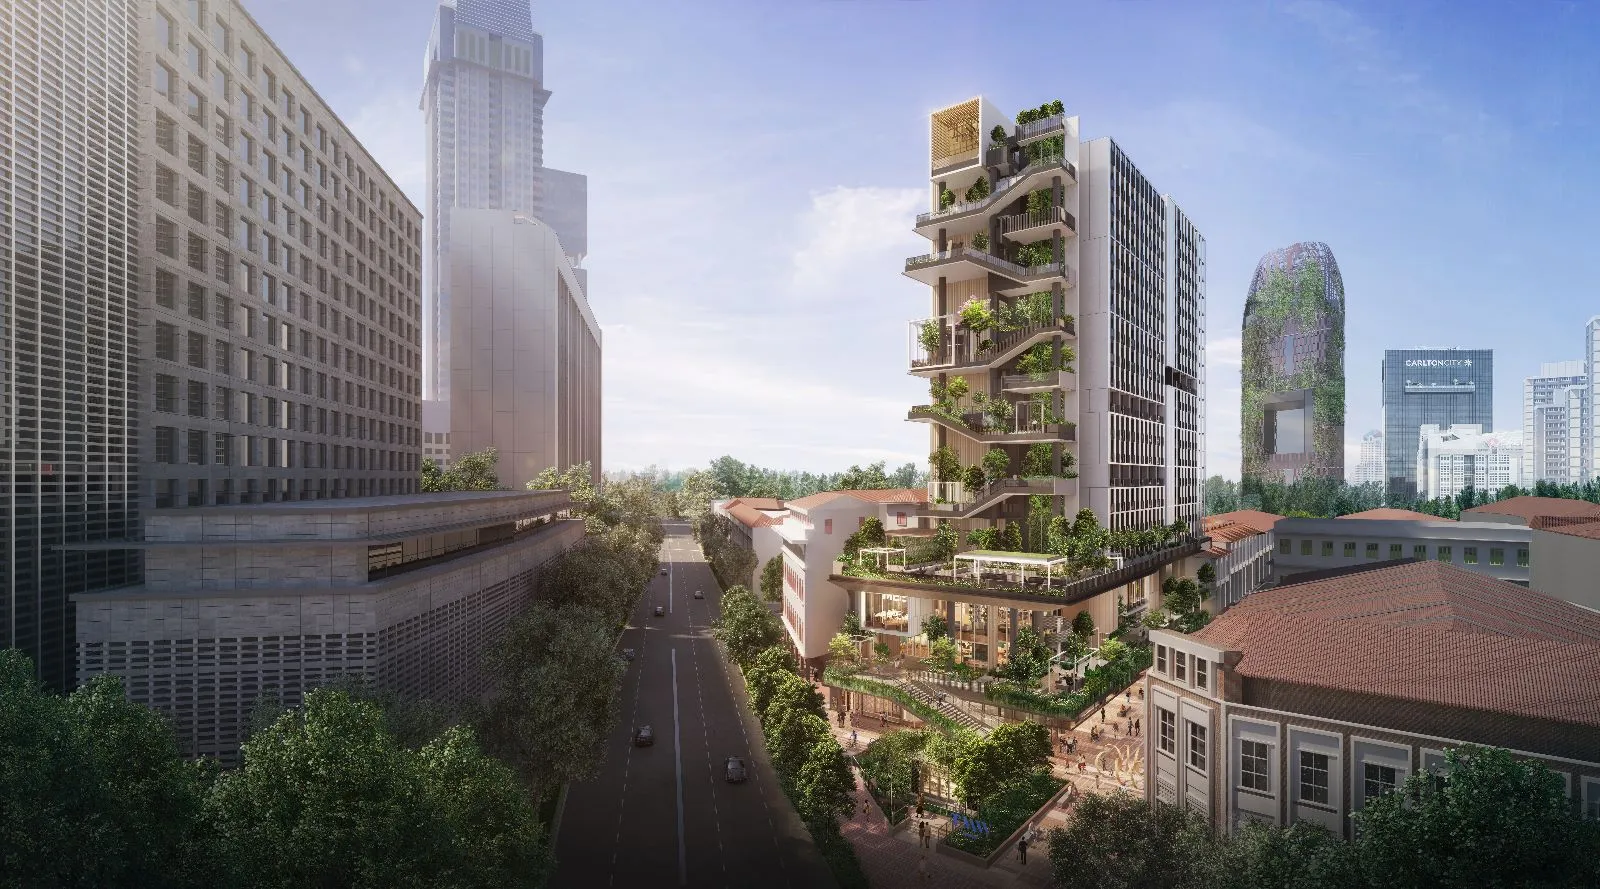 Selling
TMW Maxwell
W RESIDENCES MARINA VIEW - SINGAPORE
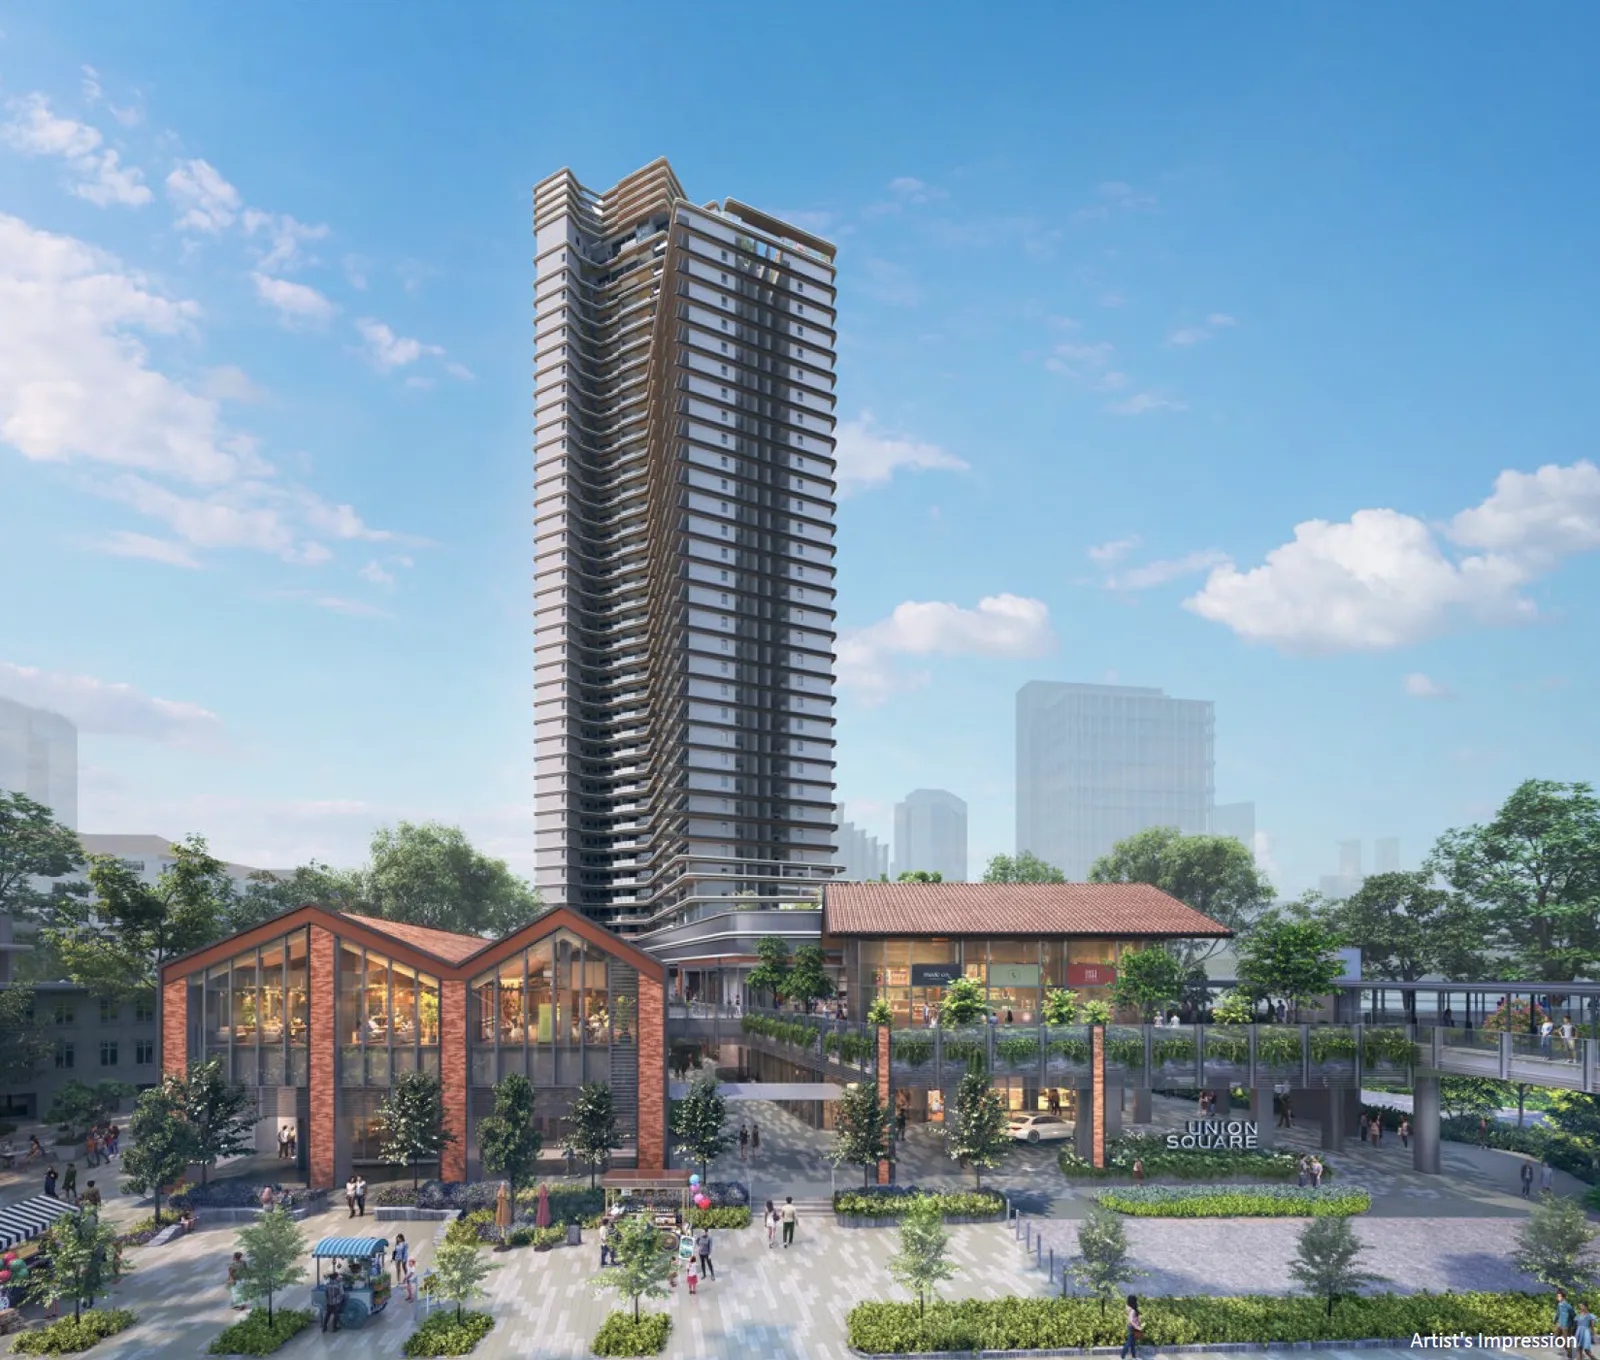 Selling
Union Square Residences 誉岭峰
Compare with nearby launches
Pick up to three to compare.
| ONE BERNAM This project |
Newport Residences 铂海峰 | TMW Maxwell | W RESIDENCES MARINA VIEW - SINGAPORE | Union Square Residences 誉岭峰 | Canninghill Piers 康宁河湾 | THE ROBERTSON OPUS | One Marina Gardens | Zyon Grand 卓悦峰 | |
|---|---|---|---|---|---|---|---|---|---|
| Stage | Developer sales to Feb 2025 | Selling | Selling | Developer sales to Aug 2026 | Selling | Selling | Developer sales to Nov 2026 | Selling | Selling |
| District | D02 | D02 | D02 | D01 | D01 | D06 | D09 | D01 | D03 |
| Distance | — | 80 m | 619 m | 748 m | 1.6 km | 2 km | 2 km | 2.1 km | 2.2 km |
| Tenure | 99-year leasehold | Freehold | 99 years commencing from 28 April 2023 | 99-year leasehold | 99 Years | 99 Years | 999-year leasehold | 99 Years | 99 years commencing from 15 July 2024 |
| Expected TOP | — | 2027 | 2027 | — | Q1 2031 | Q4 2026 | — | Q2 2029 | Q3 2032 |
| Total units | 351 | 246 | — | 683 | 366 | 696 | 348 | 937 | 706 |
| Sold to date | 351 of 351 (sold out) as at Aug 2025 |
203 of 246 (82%) as at Sep 2026 |
6 since Aug 2023 |
15 of 683 (2%) as at Sep 2026 |
242 of 366 (66%) as at Sep 2026 |
692 of 696 (99%) as at Sep 2026 |
211 of 348 (60%) as at Sep 2026 |
671 of 937 (71%) as at Sep 2026 |
637 of 706 (90%) as at Sep 2026 |
| Sold last month | 0 Aug 2025 |
0 Sep 2026 |
— | 0 Sep 2026 |
21 Sep 2026 |
1 Sep 2026 |
1 Sep 2026 |
7 Sep 2026 |
0 Sep 2026 |
| Median PSF, last 12 months | — | S$3,082 | — | S$2,646 | S$2,816 | — | S$3,368 | S$3,016 | S$3,263 |
| Typical size (sqft) | 452 – 1,421 | 452 – 1,206 | — | 710 – 1,044 | 506 – 1,066 | 463 – 1,755 | 495 – 1,152 | 420 – 1,173 | 538 – 1,421 |
| Developer price list from | — | — | — | — | — | — | — | — | — |
Sold to date and sold last month are from URA's developer sales survey where the survey covers the project, otherwise from URA developer-sale (New Sale) caveats; PSF and sizes are caveats. Developer price-list figures are the developer's own, dated, and subject to change; they are never mixed into the URA columns. Distances are straight-line.