District 19, Singapore
OLA
ShareDistrict
D19 · Serangoon Garden, Hougang, Punggol
Tenure
99-year leasehold
Developer sales recorded
May 2021 – Nov 2024
Status
Sold out
Since May 2021 (the start of URA's five-year record), the developer has sold 255 units at a median S$1,166 psf. It has since sold out: URA's developer sales survey no longer lists it.
OLA prices
What buyers have actually paid
Units sold
255
since May 2021 – Nov 2024
Median PSF
S$1,166
EC developer sales, all recorded
Developer (New Sale) caveats lodged with URA for this project, which URA records as EC. Medians are per-transaction, PSF on strata floor area as URA records it, which excludes voids for projects under URA's harmonised floor area rules (DC22-09) and may include them for older ones, and EC and private condo prices are never pooled. Source: URA, last updated Nov 2026.
Prices by unit size
| Size | Sales | Middle half of prices | Median PSF |
|---|---|---|---|
| 700 – 899 sqft | 25 | S$914,000 – S$946,680 | S$1,212 |
| 900 – 1,199 sqft | 182 | S$1,034,250 – S$1,243,375 | S$1,136 |
| 1,200 – 1,599 sqft | 44 | S$1,640,084 – S$1,738,750 | S$1,212 |
Developer (New Sale) caveats lodged with URA. The middle half is the 25th to 75th percentile price; a size band with fewer than 8 sales is not shown. PSF is on strata floor area as URA records it, which excludes voids for projects under URA's harmonised floor area rules (DC22-09) and may include them for older ones. Last updated Nov 2026.
Location & connectivity
OLA Location
The ring is 1 km from the project — about a twelve-minute walk. Map data from OneMap, © Singapore Land Authority.
MRT / LRT
Primary schools
Secondary schools
Parks
Hawker centres
MRT stations, schools, parks and hawker centres within 1 km. Distances are straight-line. Contains information from OneMap, © Singapore Land Authority.
Nearby launches
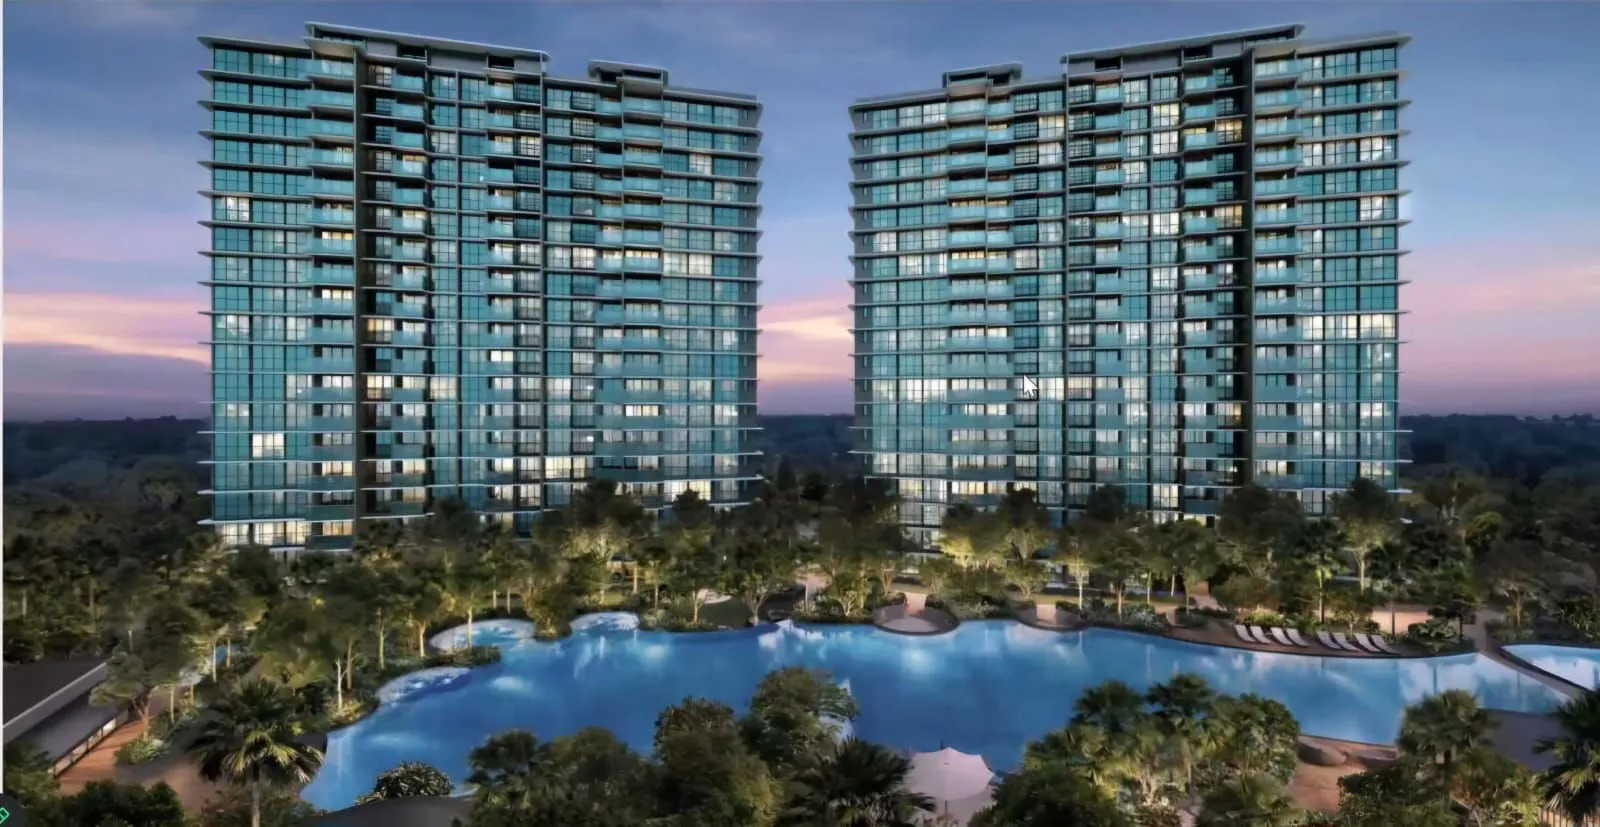
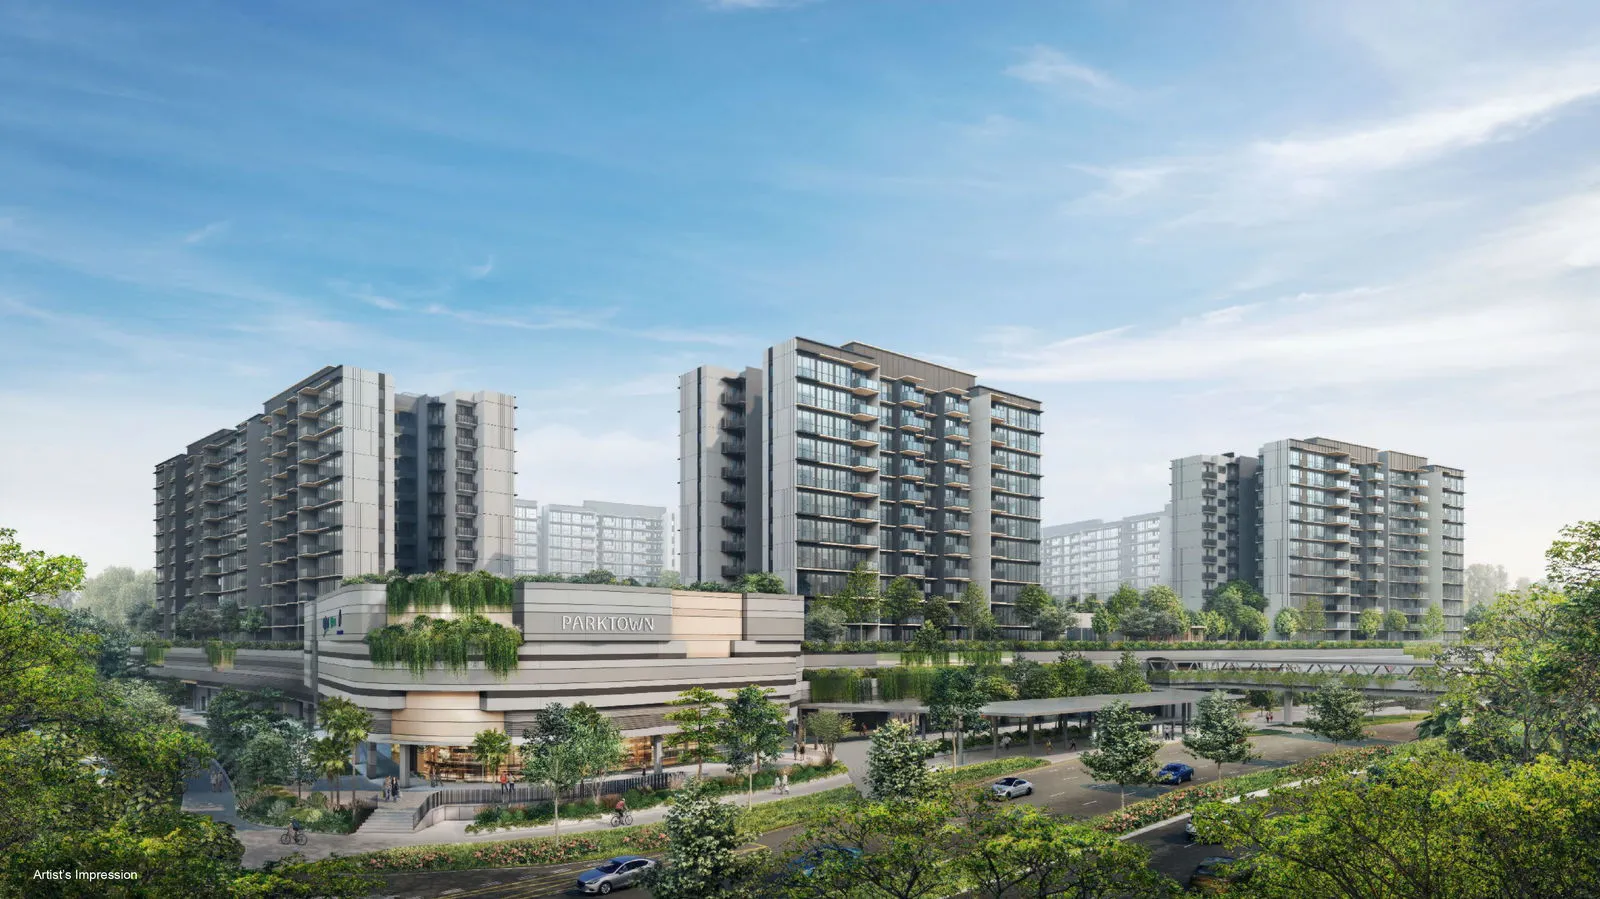
Compare with nearby launches
Pick up to three to compare.
| OLA This project |
JANSEN HOUSE | KOVAN JEWEL | Chuan Park | Parktown Residence | Aurelle Of Tampines 晶莹轩 | BARTLEY VUE | TENET | Lentor Central Residences | |
|---|---|---|---|---|---|---|---|---|---|
| Stage | Sold out | Developer sales to Jul 2026 | Developer sales to Sep 2025 | Selling | Selling | Sold out | Developer sales to May 2025 | Developer sales to Apr 2026 | Sold out |
| District | D19 | D19 | D19 | D19 | D18 | D18 | D19 | D18 | D26 |
| Distance | — | 4.5 km | 4.5 km | 5.8 km | 6.1 km | 6.2 km | 6.4 km | 6.5 km | 6.5 km |
| Tenure | 99-year leasehold | 999-year leasehold | Freehold | 99 Years | 99 years commencing from 9 October 2023 | 99 years leasehold w.e.f 8 January 2024 | 99-year leasehold | 99-year leasehold | 99 years lease commercing from 18 Dec 2023 |
| Expected TOP | — | — | — | 2028 | Q2 2030 | Q4 2028 | — | — | 2028 |
| Total units | — | 21 | 34 | 916 | 1,193 | 760 | 115 | 618 | 477 |
| Sold to date | 255 since May 2021 |
20 of 21 (95%) as at Sep 2026 |
19 of 34 (55%) as at Dec 2025 |
900 of 916 (98%) as at Sep 2026 |
1,168 of 1,193 (97%) as at Sep 2026 |
757 of 760 as at Sep 2026 |
115 of 115 (sold out) as at Nov 2025 |
618 of 618 (sold out) as at Sep 2026 |
477 of 477 (sold out) as at May 2026 |
| Sold last month | — | 0 Sep 2026 |
0 Dec 2025 |
10 Sep 2026 |
1 Sep 2026 |
0 Sep 2026 |
0 Nov 2025 |
0 Sep 2026 |
0 May 2026 |
| Median PSF, last 12 months | — | S$2,038 | — | S$2,684 | S$2,331 | S$1,937 | — | — | — |
| Typical size (sqft) | 926 – 1,389 | 721 – 1,335 | 721 – 1,208 | 700 – 1,227 | 592 – 1,184 | 840 – 1,206 | 657 – 1,356 | 926 – 1,367 | 463 – 1,399 |
| Developer price list from | — | — | — | — | — | — | — | — | — |
Sold to date and sold last month are from URA's developer sales survey where the survey covers the project, otherwise from URA developer-sale (New Sale) caveats; PSF and sizes are caveats. Developer price-list figures are the developer's own, dated, and subject to change; they are never mixed into the URA columns. Distances are straight-line.